Body Mass Index
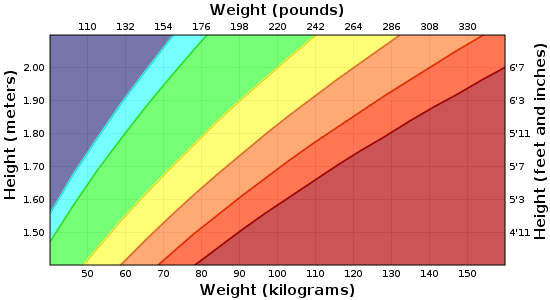
Using the Body Mass Index you can assess how much your body weight departs from what is healthy for a person of your height. Fill in your weight and length below, or click on a position within the chart.
|
27.4 Overweight |
||
|
|
You're more likely to be hungry if you're cold
Using the Body Mass Index you can assess how much your body weight departs from what is healthy for a person of your height. Fill in your weight and length below, or click on a position within the chart.
|
27.4 Overweight |
||
|
|
|
